Author: Jonathan

  • “time”

    The simulator takes a series of time steps, each of “step_seconds” duration. At each step, it calculates how the house’s energy state changes, until it reaches the longest project duration “max_project_duration_years”.

    The smaller the step, the greater the accuracy but the larger the amount of calculation required.

      "time": {
        "step_seconds": 216,
        "max_project_duration_years": 25,
        "discount_rate_pa": 0.04
      },

    The simulator needs an assumption for the annual discount rate “discount_rate_pa” in order to calculate NPV (net present value). There is no universal “one-size-fits-all” value. An optimum value for you depends on:

    • whether you use real or nominal accounting to value future cashflow: either is OK provided you are consistent;
    • attitude to how risky the project will be: if you think there is something above averagely risky about it, it may be reasonable to increase the value;
    • expected post tax return from alternative investments.

    I prefer the real accounting approach and set “discount_rate_pa” to the post tax historic inflation adjusted S&P500 growth index rate.

  • “#” or “comment”

    It’s good to add notes and comments to your JSON house description. Add comments in the same way you add data, using a data name that does not conflict with the simulator’s reserved names. So, to be sure of avoiding conflicts, use “comment” or “#”. For example:

    "comment": "This is a comment",
    "#": "This is another comment",

  • “combine”

    It is important to consider multiple combinations of renewable components when planning in order to undertand and harness the NPV synergies between them.

    The effect on NPV from adding a component is not necessarily additive. Suppose a heat pump and solar PV improve the NPV by £HP and £PV respectively when installed alone. Implementing both, however, does not necessarily result in £(HP+PV). Sometimes there is a synergy, but sometimes there isn’t.

    In our case, batteries and heat pumps made virtually no financial sense together or on their own, but both can pay off if combined with sufficient solar pv. We were able oversize our solar install to the limit with 40 panels: these become a significant “free” source of electricity for the heat pump, even in winter: see graphs below. Your mileage may vary.

    For these reasons it is important to simulate renewables together: specify in “combine”1 up to four renewable components2 to combine by adding them the JSON description3.

    "combine": {
     "battery",
     "solar_pv",
     "heat_pump"
    },

    The above example tells the simulator to simulate each of the combinations of battery (B), solar_pv (PV) and heat pump (HP) as follows:

    • none: no components at all4;
    • PV: keep the boiler and just add solar PV panels;
    • HP: just replace the boiler with a heat pump;
    • HP, PV: replace the boiler with a heat pump and add solar PV;
    • B: keep the boiler and just add a battery;
    • B, PV: keep the boiler and add both a battery and solar PV;
    • B, HP: add a battery and replace the boiler with a heat pump;
    • B, HP, PV: add a battery, replace the boiler with a heat pump and add solar PV.

    Two plots of NPV vs project duration are displayed :

    • absolute NPV for each combination, including none;
    • NPV for each combination relative to none.

    Here’s are the absolute NPV for each combination for our house, including the NPV for “none” (staying with our 2 year old oil boiler):

    … and here are the NPVs compared to doing nothing for each combination:

    Note:

    1. If you omit “combine” or leave it empty, a single combination of the components marked for inclusion are simulated. ↩︎
    2. You can use up to four renewable components in “combine”: “battery”, “heat_pump”, “insulation”, “solar_pv” and “solar_thermal”. ↩︎
    3. When not added to “combine”, other renewable components are included in the simulation of the combinations if their component is marked to be included (i.e. “include”: true). ↩︎
    4. It’s always necessary to compare with the NPV if we do nothing, i.e. stay with our old boiler, insulation etc and continued with our existing energy consumption profile (e.g. oil and electricity). The simulator refers to this as the “none” project, where no renewable component is included. ↩︎
  • “boiler”

    The simulator always assumes that your existing central heating system has a conventional oil or gas boiler.

    To describe your boiler:

    • use the “include” flag to include it, otherwise the simulator assumes your house has no boiler and is heated with electricity;
    • include in “tariff” the name of the energy tariff it is using;
    • give the heating capacity of your boiler in “output_kw”;
    • give the boiler’s efficiency in “efficiency”;
    • in “cost” include only any additional costs that will be incurred when using in “install_gbp”: normally it is zero. Also include its annual maintenance cost in “maintenance_pa_gbp”.

  • Simulation steps

    I wrote a time series simulation program (“simulator”) to help make pick the best renewable combination. The simulator shows the options that make best financial sense by displaying their NPVs. After deciding project duration, one simply picks the combination with the highest NPV.

    The simulator runs as a web server and accept POST requests containing a JSON description of the project. After running the simulation, it gives a link to a graph of NPVs for each combination.

    The first step in creating the JSON is to decide the maximum duration you want to be committed to your investment and benefit from its returns. Commitments and returns are typically:

    • preparation costs, e.g. tearing out the old boiler, oil tanks and necessary buiding or electrical work prior to install;
    • installation costs;
    • periodic maintenance costs;
    • ongoing (hopefully greatly reduced) electricity costs;
    • income (if any) from exported electricity.

    Create the JSON description

    Describe your house and project in text description using JSON to allow the simulator to calculate your project’s future energy and financial performance.

    The text needs to quantify several parameters, as follows:

    Making a request

    Now you have your JSON, you need to forward it as a POST request to the simulator.

    If you’re developer with LAMP skills, you may want to pull the simulator from GitHub and mount it on your own server.

    Alternatively, you can submit a request to my server.

    Understanding the result

    A line with a zero slope implies a project with no overall running costs, and a line with a positive slope implies a project that is cash positive. But we should always prefer the permutation with the highest NPV depending on the duration we assume. Looking at the graph above, that meant we should stay with our old boiler (i.e. “none”) unless we could assume a duration longer than 5 years.

    Fitting a heat pump on its own (“HP” line) had the earliest duration at which any investment made sense. But note how this line still slopes downwards, just not as steeply as the “none” one.

    Perhaps surprisingly, the heat pump made sense before the solar PV only “PV” line did at 6 years. One might expect a synergy between heat pumps, which benefit from cheap electricity, and solar PV. But doing both (i.e. “HP, PV”) only makes sense when considering project durations of 11 years or more. This is because solar PV panels do not generate electricity when heat pump use it most, when it’s cold and dark outside.

    Thinking long term

    More extensive and costly projects tend to prove more attractive with longer project durations. We were not planning to move which, from a renewable planning perspective, made it possible to think in terms of augmenting a heat pump with solar PV and a battery.

    While solar PV alone does not reduce heat pump runnning costs, it does reduce overall energy consumption and greatly reduces the slope of the NPV line. Low running costs are good for NPVs in the long run. And indeed, we managed to improve the long run NPV even further by add adding a battery “B”.

    Fitting a battery on its own (“B”) is pretty much the worst investment decision one can make. While it is possible to store cheap electricity and scrape a profit by export it at peak times, these profits are so slim as to be not worthwhile unless one is prepared to wait around 17 years.

    But while expensive initially, batteries have great synergies with heat pumps and solar PV panels. They can import electricity from the grid at times when it is cheap and, conversely, can store solar energy for export at better peak times for exporting back to the grid, typically between 4pm and 7pm.

    If we planned to be in the house longer than 10 years (which we do), a heat pump on its own would be sub-optimal and it would instead make greater sense to install also solar PV and a battery.

    And in the very long term (25 years), there is a staggering near £60,000 long term cost from doing nothing – compared to fitting those renewable components today. That figure is all the more astonishing when one considers that it is a priced at the present day, not some figure discounted way into the future. In other words, our renewable project was financially equivalent to receiving a £60k cheque on the day we embarked on it … at least theoretically!

  • Net present value (NPV)

    Renewable systems can have great engineering performance but, unless you check carefully, it’s easy to choose a system:

    • whose costs outweigh its benefits, or is;
    • not optimally sized for your home.

    As a result, each system should be appraised and compared financially.

    There are several ways to do this, such as choosing the one with the shortest payback period, or the one with the highest internal rate of return (IRR) or highest net present value (NPV).

    When comparing renewable systems, NPV is best because payback and IRR do not consider size of investment. For example, adding a tiny PV system with just a few panels to Windsor Castle castle might pay for itself quickly and show a great IRR … but it would make little difference. Payback and IRR won’t tell you how much better you off you would be compared to doing nothing.

    Payback and IRR also ignore opportunites foregone. For example, does a £50,000 ground source heat pump that saves £2,500 a year in electricity costs make sense if we have to fund it by selling stocks that average a 10 percent return? Payback has nothing to say on this, but IRR does. If the project’s IRR, in this example case 5 percent = £2,500 divided by £50,000 (assuming the heat pump lasts forever), is less than the 10 percent expected elsewhere … we shouldn’t go for it.

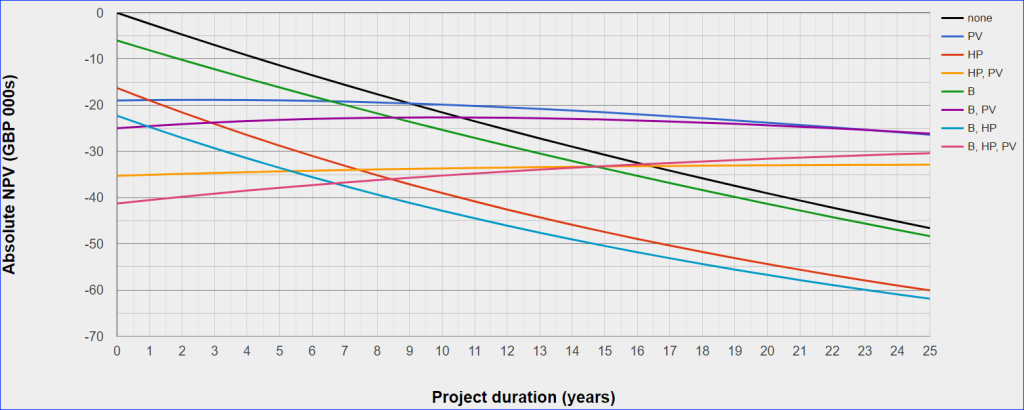
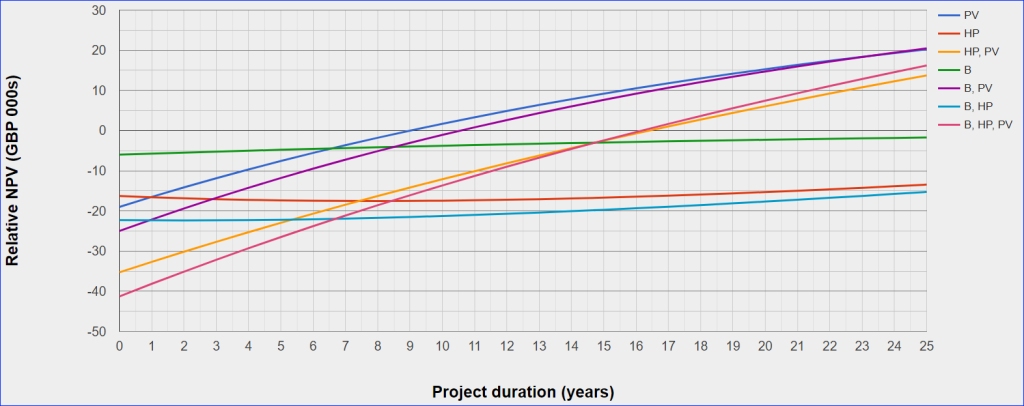
    NPV estimates each system’s absolute financial value and compares this to doing nothing or investing elsewhere.

    The NPV formula:

    \text{NPV} = \sum_{t=0}^{n} \frac{I_t}{(1 + r)^t}

    estimates how much a project is worth today if you go ahead with it.

    It divides all incomes and costs (negative), associated with the project by a discount factor and adds them all together.

    Consider for example a heat pump + solar PV system. This has a bunch of initial (t=0) planning, purchase and install costs. Then it has a series of costs such as electricity and maintenance charges throughout the project’s life and, hopefully, also positive incomes from solar exports.

    Each income amount is divided by a factor (1+r)t to reflect that monies at an expected time, t, in the future is less interesting than money in the bank today. r is the discount rate and varies widely according to market factors (i.e. interest and inflation) and your own personal attitude to risk and investment.

    NPV is only as good as the assumptions made when using it so that, while its formula is conceptually simple, the process of calculating each term, even with a spreadsheet, can be tedious and slow due to the complexity of most renewable components.

    While the NPV formula is simple large formulae, typicallly using many parameters, are required to acurately describe each renewable component.

    Calculation complexity increases further when components are combined. For example, a heat pump with multiple solar PV arrays and a storage battery.

    Another complication is electricity cost. Gone are the days when electricity had a single price. These days tariffs, especially the ones for homes with renewables, fluctuate throughout the day in ways that defy estimating intuitive averages.

    For these reasons and more besides, rigorous NPV calculation appears seldom used when appraising domestic renewable designs. It has simply been too difficult.

    For me that is a pity, because the investment required from me was large, running into several £10ks, and I wanted to be confident that I was getting the best system our money could buy.

    While you may not want to be ruled by financial measures when saving the planet, the counter argument is that NPV allows you, where desired, to favour investments that maximise CO2 saving per investment. To achieve this just price its cost saving and add it to the NPV formula.

  • Finding the right components

    To find the best renewable system, you’re going to need to:

    • decide what system components to get
    • shop around for different types, brands and sizes of systems;
    • describe each system in terms of its specification;
    • make a few other assumptions;
    • simulate each system;
    • choose the system with the best NPV.

    Deciding on components

    There are many components out there: solar PV panels, thermal panels, heat pumps, energy storage and, of course, insulation.

    In many or most cases, adding a single component does not make optimal financial sense. For example, without adequate insulation, replacing a gas boiler with a heat pump could dramatically increase your heating costs.

    Also, heat pumps consume large amounts of electricity during the day and often benefit from a storage battery in order to access cheap night tariffs.

    The same is true for solar PV panels which earn more from solar electricity when it is exported at peak evening rates … requiring a battery.

    Solar PV is not the only form of renewable energy generation. Heat can also be generated from thermal panels and stored in water tanks. However, where a heat pump is to be installed, it is normally more economic to use heat water via a heat pump from solar PV generation.

    Solar PV is not the only kind of renewable generation. Wind turbines are an alternative. While they make great sense on industrial farms, mounted high on masts on hilltops and out to sea, they seldom make any economic sense in domestic situations – and are best ignored.

    The “holy quartet”

    For the foregoing reasons, and to keep things simple, we are going to focus on finding an optimum (i.e. most financially profitable) combination of up to four components:

    • insulation;
    • solar PV;
    • electrical storage battery;
    • heat pump